In the short run, the stock market is a voting machine, in the long run, it is a weighing machine –Benjamin Graham
Although there is some debate about the attribution of the above quote, there is no doubt concerning its meaning and the philosophical implications on investment style and short and long-term returns. Essentially, short term investors can push stock prices up and down based on either mania or gloom in the short-term news flow. Investors are “voting” through their purchases of stock when they believe there are good times ahead and selling when they are less optimistic.
What would you pay for a dollar of profit?
Imagine that you are a real estate investor and you are looking to buy an income property. You would analyze many factors but you would especially focus on the cash flows. How much income after expenses does the property produce relative to the price you are willing to pay.
Expressed as a ratio, how many dollars do you have to spend for every one dollar of net income or profit. For a $300,000 property, you would probably expect to receive $20–30,000 worth of income. As a ratio, this would equate to a purchase price of 10 to 15 times net income.
The graph to the left relates that exact same ratio information for the stock market. During the bear markets of the ‘70s and early ‘80s, investors “voted” the price of net income down to 7–11 times net income. Contrarily, during the mania of the late ‘90s, the same investors “voted” their optimism in the market until it was valued at 25–30 times that same net income. Today, the stock market is valued at approximately its fifty year average. 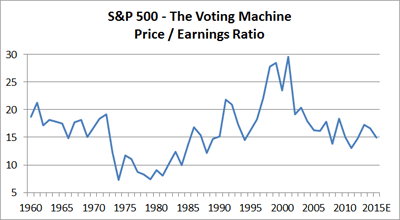
Will your profit grow?
Now we move on to the scales. Considering the volatility of the above graph, you would expect the net income of America’s largest corporations to be quite unpredictable. Actually, with a proper long term perspective, the earnings and dividends of the companies that make up the S&P 500 are reasonably stable. At right, we have displayed a graph of exactly that data for the past 50 plus years.
There are certainly bumps in the road, but the long term trend is generally smooth and unmistakably up. As an investor, it is these earnings and dividends that embody that mass that is measured by Graham’s long term weighing machine.
So, why did the market go nowhere from 2000 to 2012?
This is the second most interesting question today. In 2000, at the previous stock market high of 1,552, the earnings and dividends of the S&P 500 were $56 and $16.27 respectively. At the risk of being redundant, using the ratio price paid to net income or 1,552/56, investors paid $28 for $1 worth of earnings. Fast forward to 2012, earnings and dividends for the same S&P 500 were expected to be $105 and $27 respectively. Yet earnings grew 87.5% and dividends increased by 65%. Even though the stock market seemed stagnant, the fundamental metrics by which the companies that comprise the market are measured have performed admirably — it is simply that the ratio of revenues to profits has reverted back to the mean.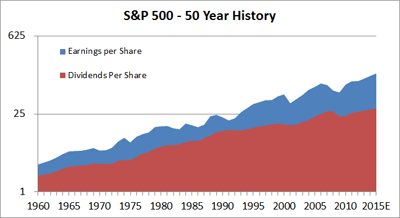
What does this mean for the stock market over the next five to ten years?
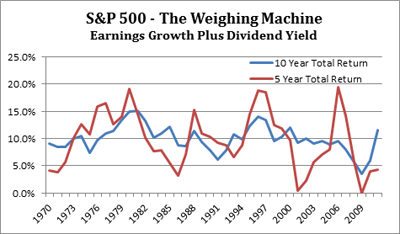
This is the always the most interesting question. The best and most honest answer is no one knows. That said, the next chart can help us to develop an educated guess. It illustrates the annual growth in earnings plus the dividend yield for rolling five and ten year periods from 1960. This is the weighing machine; this is what will drive long term growth in the market that an equity investor receives if they have the patience to ignore the short term volatility created by the “voters” and their buys and sells. For any five year period, this measure of return never went below zero and averaged 10%. For ten year periods, the return data was much less volatile and went below 5% just once while averaging the same 10%. There is no reason to believe that the stock market will not achieve a modest version of these returns. In the long run, the stock market will eventually reflect the fundamental growth in net income of the companies in the index.
Putting it all together
If you to combine the information about current valuation from the first chart with the knowledge that earnings grow over the long run from the second chart and that growth will be between 4% and 15% over a ten year period from the last chart, you will know why we are cautiously optimistic about the stock market at this point in time. There will be gloom and mania as the “voters” push the market around in the short term but as corporations “weigh” in with profit growth and dividends, the prospects for a long term investor have a good probability for success.
[hr]